

Article details
Water is the one force that every piece of civil infrastructure must deal with. Too little, and cities and farms go short. Too much, and roads wash out, towns flood, and dams are tested to their limits. The discipline that studies the movement, distribution, and management of water is hydrology, and when it is applied to design it becomes water resources engineering. This article explains how water moves through the environment, how engineers measure and predict it, and how that knowledge shapes dams, drainage systems, and flood control works.
Part 1: The Hydrologic Cycle
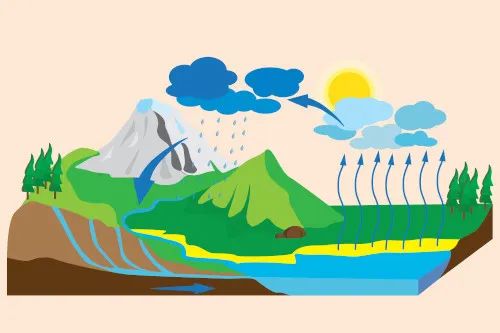
Water is constantly moving between the atmosphere, land surface, and ground. Engineers track this cycle as a balance of inputs, outputs, and storage.
Process | What happens | Why it matters in design |
|---|---|---|
Precipitation | Rain, snow, hail, and dew reach the ground | The main input, which drives flood and drought estimates |
Interception | Vegetation and surfaces hold some water | Reduces early runoff |
Infiltration | Water soaks into the soil | Controls how much becomes runoff |
Percolation and groundwater flow | Water moves deeper and flows slowly underground | Supplies wells, springs, and baseflow in rivers |
Surface runoff | Water flows over land into channels | Determines peak flows for drains, culverts, and spillways |
Evaporation and transpiration | Water returns to the air from surfaces and plants | A major loss from reservoirs and catchments |
Storage | Water held in lakes, soil, aquifers, and reservoirs | Buffers floods and droughts |
Water balance equation (simple form):
Precipitation = Runoff + Evapotranspiration + Infiltration/Storage change
Every hydrologic study, from a small roadside drain to a river basin plan, rests on some form of this balance.
Part 2: Watersheds and How Water Is Distributed
A watershed (catchment or basin) is the land area that drains to a single outlet. It is the basic unit of water resources planning.
Key catchment characteristics
Area and shape: larger and rounder basins produce bigger, more concentrated peaks
Slope and relief: steep catchments respond quickly
Land use and cover: forests slow runoff, while pavement and roofs speed it up
Soil type: sandy soils infiltrate readily, while clays shed water
Drainage density: more streams per unit area means faster response
Antecedent moisture: saturated ground produces more runoff from the same rain
Distribution of water resources
Surface water: rivers, lakes, reservoirs, canals
Groundwater: aquifers tapped by wells and tubewells
Seasonal variation: monsoon, snowmelt, and dry-season flows
Spatial variation: regions of surplus and scarcity, which drive inter-basin transfers and storage projects
Part 3: Collecting and Analyzing Hydrologic Data
Good design depends on good data. Typical sources and tools include:
Rain gauges and radar for rainfall depth, intensity, and distribution
Stream gauging stations measuring water level and flow (discharge)
Rating curves linking water level to discharge
Evaporation pans and weather stations
Observation wells for groundwater levels
Sediment sampling in rivers and reservoirs
Satellite imagery, remote sensing, and GIS for land cover, snow, and flood mapping
Digital elevation models to delineate catchments and flow paths
Statistical analysis
Because floods and droughts are rare events, engineers study long records and fit probability distributions to estimate how big an event of a given rarity can be.
Return period (T): the average interval between events of a given size
Probability of exceedance: roughly 1/T in any one year. A 100-year flood has about a 1 percent chance of being equaled or exceeded in any year.
Common distributions include Gumbel, log-Pearson Type III, and log-normal.
Intensity-duration-frequency (IDF) curves give design rainfall intensity for a chosen duration and return period.
Part 4: Estimating Runoff and Design Floods
Methods for small catchments
Rational method
Q = C × i × A / 360 (for Q in m³/s, i in mm/h, A in hectares)
C is the runoff coefficient (about 0.1 for grass, 0.9 or more for pavement)
i is rainfall intensity for a duration equal to the time of concentration
A is the catchment area
Widely used for urban drains and culverts on small catchments.
SCS Curve Number method
Estimates runoff depth from rainfall using a curve number that reflects soil group, land cover, and moisture condition. Useful for rural and mixed catchments.
Methods for larger catchments
Unit hydrograph method: uses the hydrograph produced by one unit of rainfall excess over a catchment, scaled and combined to predict flood hydrographs
Flood frequency analysis: fits a distribution to recorded peak flows
Regional methods: use equations from similar nearby basins when data is scarce
Rainfall-runoff simulation models: such as HEC-HMS, SWMM, and similar tools
Design floods for dams
Large dams are designed for rare, extreme events, because failure can be catastrophic.
Probable Maximum Precipitation (PMP): the greatest rainfall physically possible over a catchment
Probable Maximum Flood (PMF): the flood resulting from PMP under unfavorable conditions
Design flood levels depend on dam size, hazard classification, and the code applied. High-hazard dams are typically designed for the PMF or a very large fraction of it, while smaller structures use floods of a chosen return period such as 100 or 1000 years.
Part 5: Flood Routing
Flood routing tracks how a flood wave changes as it moves through a reservoir or river reach.
Reservoir routing: the incoming flood is stored temporarily, reducing and delaying the outflow peak. This is how a reservoir attenuates floods.
Channel routing: the Muskingum method and hydraulic models show how the wave flattens and travels downstream.
Routing results set the spillway capacity, required flood storage, and freeboard.
Part 6: Designing Dams
Purposes
Water supply, irrigation, hydropower, flood control, navigation, recreation, and sediment retention. Many dams serve several purposes.
Types of dams
Type | How it resists water | Suitable conditions |
|---|---|---|
Gravity dam | Its own weight resists thrust | Strong rock foundation |
Arch dam | Curved shape transfers load to the abutments | Narrow gorge with strong rock walls |
Buttress dam | Sloping deck supported by buttresses | Moderate rock quality, less concrete than gravity |
Embankment (earth-fill / rock-fill) dam | Mass of compacted soil or rock | Wide valleys, weaker foundations, local materials |
Roller-compacted concrete (RCC) dam | Gravity section built in compacted layers | Fast, economical gravity dams |
Concrete-faced rock-fill dam | Rock-fill body with an impervious concrete face | Rock available, steep abutments |
Key reservoir levels
Dead storage: below the lowest outlet, holds sediment
Live (useful) storage: between minimum and normal operating levels
Flood storage (surcharge): temporary space for flood control
Full Reservoir Level (FRL) and Maximum Water Level (MWL): the normal and flood limits
Freeboard: safety margin between MWL and the crest, allowing for waves and settlement
Dam design process
Site selection and investigation: topography, geology, faults, seepage paths, material sources, and reservoir rim stability
Hydrology: yield studies, design flood, sediment inflow
Selection of type and layout based on foundation, materials, and cost
Stability analysis
Gravity dams: overturning, sliding, bearing, and uplift
Embankments: slope stability, seepage, and settlement
Arch dams: stress analysis and abutment stability
Seepage control: cut-offs, grout curtains, filters, drains, and internal zoning
Spillway, outlets, and energy dissipators
Seismic design: earthquake loads, and liquefaction checks for embankment dams
Instrumentation plan for monitoring
Emergency Action Plan (EAP) for downstream warning and evacuation
Spillways and outlets
Component | Function |
|---|---|
Ogee (overflow) spillway | Passes floods over the crest of a concrete dam |
Gated spillway | Gates control the discharge and allow higher storage |
Chute and side-channel spillways | Common with embankment dams |
Morning glory (shaft) spillway | Vertical shaft inlet for restricted sites |
Stilling basin and flip bucket | Dissipate energy to prevent scour at the toe |
Bottom outlets and sluices | Release water for irrigation, drawdown, and sediment flushing |
Intake towers and penstocks | Draw water for supply or hydropower |
For embankment dams in particular, overtopping is the leading cause of failure, so spillway capacity and reliability are critical.
Dam safety and monitoring
Instruments: piezometers for pore pressure, seepage weirs, settlement gauges, inclinometers, strain meters, and seismographs
Regular inspections by trained engineers, with independent safety reviews at intervals
Hazard classification based on the consequences of failure downstream
Operation rules: reservoir operating guides for floods and drought
Early warning and emergency planning
Part 7: Designing Drainage Systems
Urban stormwater drainage
Goal: remove rainwater from roads and developed areas quickly enough to prevent flooding, without causing problems downstream.
Components
Kerb inlets and gullies
Underground pipes and box culverts
Open drains and channels
Manholes and junctions
Detention and retention ponds
Outfalls and energy dissipators
Pumping stations where gravity drainage is not possible
Design steps
Delineate sub-catchments and estimate area and runoff coefficient
Choose the design storm (commonly 2 to 10 years for minor drains and 50 to 100 years for major flood paths, depending on local standards)
Calculate time of concentration and design intensity from IDF curves
Compute peak flow using the rational method or a modeling tool
Size pipes and channels using Manning's equation
Manning's equation:
V = (1/n) × R^(2/3) × S^(1/2)
where V is velocity, n is roughness, R is hydraulic radius, and S is slope.
Check minimum velocity (commonly 0.6 to 0.9 m/s, to prevent silting) and maximum velocity (to prevent scour and abrasion)
Design levels, gradients, and invert elevations so flow runs by gravity
Check the hydraulic grade line and surcharge conditions
Plan for exceedance flows, meaning what happens when a storm is larger than the pipe capacity
Sustainable drainage (SuDS and low-impact development)
Rather than rushing water away, these approaches slow, store, and clean it near the source:
Permeable pavements
Swales and vegetated channels
Rain gardens and bio-retention areas
Green roofs
Infiltration trenches and soakaways
Detention basins and constructed wetlands
Rainwater harvesting
These reduce peak flows, improve water quality, recharge groundwater, and are increasingly required by planning rules.
Highway and road drainage
Camber and cross-slope to shed water from the surface
Side drains, catch drains, and intercepting drains
Cross-drainage works: culverts and small bridges sized by design flood and allowable headwater
Sub-surface drains for high water tables
Scour protection at inlets and outlets
Agricultural and land drainage
Surface drains to remove excess rain
Subsurface (tile) drains to lower the water table and prevent waterlogging and salinity
Outfall channels and pumping where needed
Culvert design basics
Determine design flow and allowable headwater
Choose shape and size (pipe or box), checking inlet and outlet control
Provide adequate cover, bedding, and end structures
Allow for debris passage and, where relevant, fish passage
Protect against scour with aprons or riprap
Part 8: Flood Control and Management
Understanding flood types
River (fluvial) floods from prolonged or intense rainfall in the basin
Flash floods from short, intense storms in steep catchments
Urban (pluvial) floods from drainage capacity being exceeded
Coastal floods from storm surge, tides, and sea-level rise
Dam-break and glacial lake outburst floods
Structural measures
Measure | How it helps |
|---|---|
Reservoirs and flood storage dams | Store flood volume and release gradually |
Levees (embankments) and flood walls | Confine river flow and protect adjacent land |
Channel improvement and straightening | Increase capacity (with downstream effects to consider) |
Diversion channels and floodways | Carry excess flow around towns |
Detention basins and flood retarding basins | Temporarily hold water |
Pumping stations | Drain protected areas behind levees |
Spillways and relief channels | Provide safe passage for extreme flows |
Sea walls, storm surge barriers, and tidal gates | Protect coasts and estuaries |
Check dams and erosion control in the catchment | Slow runoff and trap sediment |
Non-structural measures
Floodplain zoning and land-use control to keep people and buildings out of high-risk areas
Flood forecasting and early warning systems using rainfall, river gauges, and models
Flood insurance and emergency preparedness
Flood-proofing and raised building levels
Public awareness and evacuation planning
Catchment management: reforestation, soil conservation, and wetland protection
Restoring floodplains and natural storage where possible
Modern practice combines both groups. Structural works reduce the chance of flooding, while non-structural measures reduce the damage when something larger than the design event occurs.
Levee design basics
Alignment set back from the river where possible, to give flow room
Crest height set from design flood level plus freeboard
Stable side slopes, with seepage control and filters
Slope protection against erosion, such as grass, riprap, or concrete
Provision for drainage of the protected land
Regular inspection for burrows, cracks, seepage, and settlement
Part 9: Groundwater and Water Supply
Groundwater management
Aquifer characterization through pumping tests and borehole data
Safe yield: pumping rates that do not exceed recharge over time
Artificial recharge using ponds, check dams, and injection wells
Protection from contamination and saltwater intrusion
Water supply planning
Demand forecasting for domestic, industrial, and agricultural users
Source selection and reliability analysis
Reservoir yield and storage-yield relationships
Treatment, transmission, and distribution design
Conservation, leakage reduction, and reuse
Part 10: Integrated Water Resources Management (IWRM)
Water systems are interconnected, so decisions in one place affect others. IWRM coordinates the development of water, land, and related resources to balance:
Economic needs: irrigation, power, industry, urban supply
Social needs: safe drinking water, flood safety, livelihoods
Environmental needs: ecological flows, wetlands, water quality
Practices include basin-level planning, stakeholder participation, reservoir operating rules that serve multiple purposes, and water allocation agreements between users and regions.
Part 11: Climate Change and Uncertainty
Rainfall extremes are becoming more intense in many regions, so older IDF curves and flood records may understate future risk
Snowmelt timing, glacier retreat, and sea-level rise change flow patterns
Designers increasingly apply climate change allowances to design rainfall and flows
Adaptive design allows structures to be upgraded in future, such as space for raised levees or extra drainage capacity
Risk-based thinking replaces single design numbers: what happens beyond the design event, and how can failure be made gradual and safe
Part 12: Common Failures and Their Causes
Failure | Typical causes |
|---|---|
Dam overtopping | Under-sized spillway, blocked gates, underestimated flood |
Piping and internal erosion | Poor filters, cracks, or seepage along conduits |
Foundation failure or sliding | Weak rock, high uplift, undetected faults |
Levee breach | Overtopping, seepage, burrowing animals, scour at toe |
Drain surcharge and urban flooding | Design storm too small, blocked inlets, increased impervious area |
Culvert washout | Blockage, undersized opening, scour at outlet |
Reservoir siltation | High sediment inflow, no catchment treatment or flushing |
Landslides into reservoirs | Unstable rim slopes |
Part 13: Good Practice Summary
Start with reliable data and a long enough record
Choose design floods that match the consequence of failure
Always check what happens when the design event is exceeded
Treat catchment, channel, and structure as one system
Design for maintenance: access, cleaning, and inspection
Combine structural and non-structural flood measures
Use sustainable drainage to reduce peak flows at source
Instrument and monitor major structures for their whole life
Prepare emergency action plans and test them
Update designs as climate and land use change
Conclusion
Safe water infrastructure begins with understanding how water behaves: where it falls, where it goes, how fast it moves, and how rare the extreme events are. Engineers who read the catchment, trust good data, and respect uncertainty design dams that pass floods safely, drains that keep cities working, and flood defenses that protect people without creating new risks elsewhere. As rainfall patterns shift and development spreads, the best designs are those that combine strong structures with space for water, reliable monitoring, and plans for the day when the biggest storm exceeds expectations.