

Article details
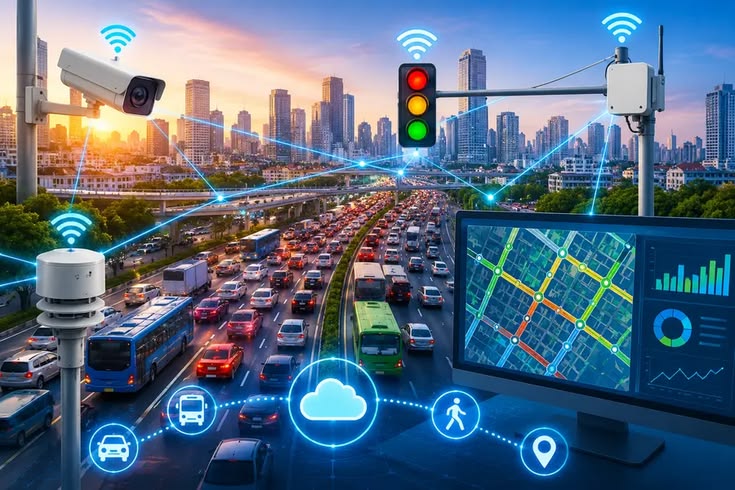
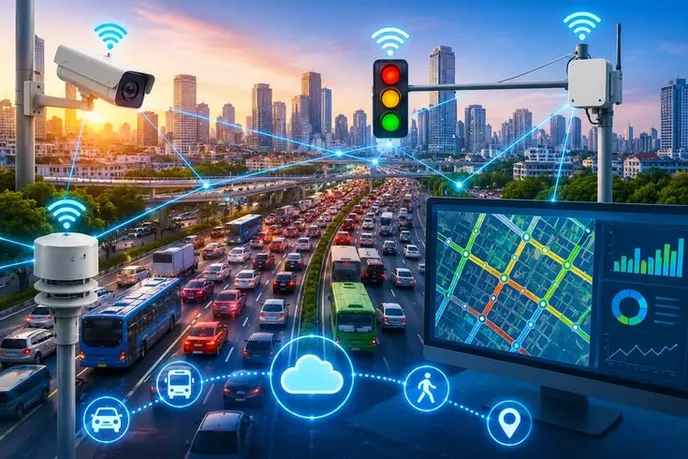
An Intelligent Transportation System (ITS) applies sensing, communications, and data analytics to the transport network so that traffic can be monitored, predicted, and managed in real time. Sensors and connected vehicles collect data on flow, speed, and incidents. Analytics and machine learning turn that data into forecasts and decisions. Control systems then act: they retime signals, meter ramps, change speed limits, reroute traffic, and inform drivers. The goal is to get more out of existing roads, rather than only building new ones.
Why ITS Is Needed
Building new road capacity is costly, slow, and often impossible in dense cities
A large share of congestion is non-recurring, caused by crashes, breakdowns, weather, work zones, and events, which fixed-time plans cannot handle
Stop-and-go traffic wastes fuel, increases emissions, and raises crash risk
Travel-time reliability matters as much as average speed for commuters and freight
Public transport, emergency services, and logistics all benefit from priority and better information
The ITS Architecture (How It Fits Together)
Layer | Function | Examples |
|---|---|---|
1. Sensing and data collection | Capture what is happening on the network | Loop detectors, cameras, radar, probe data |
2. Communications | Move data reliably and quickly | Fiber, 4G/5G, DSRC, C-V2X, Wi-Fi |
3. Data management | Store, clean, fuse, and share data | Cloud platforms, data lakes, APIs |
4. Analytics and intelligence | Detect, predict, and optimize | Machine learning, simulation, digital twins |
5. Control and management | Turn decisions into actions | Signal controllers, variable message signs, ramp meters |
6. User services | Inform and guide travelers | Navigation apps, 511 services, public transport apps |
7. Institutions and policy | Coordinate agencies and ensure standards | Traffic management centers, data-sharing agreements |
Sensing Technologies
Sensor | What it measures | Strengths | Limitations |
|---|---|---|---|
Inductive loops | Presence, count, occupancy, approximate speed | Proven, accurate counts | Pavement cutting, maintenance, failure under repair works |
Video cameras with AI | Counts, classification, queues, incidents, turning movements | Rich data, visual confirmation | Affected by lighting, weather, occlusion |
Radar and microwave | Speed, count, presence | Works in poor weather, non-intrusive | Lower classification accuracy |
LiDAR | 3D position, speed, classification | Precise, good for pedestrians and cyclists | Cost, weather sensitivity |
Magnetometers | Vehicle presence | Wireless, easy to install | Limited range |
Bluetooth and Wi-Fi readers | Travel time between points | Cheap, route-level travel time | Sample only |
ANPR / license plate recognition | Vehicle identity, travel time, enforcement | Accurate origin-destination and travel times | Privacy concerns, regulation |
Probe data (GPS, smartphones, fleet) | Speeds and routes over wide areas | Network-wide coverage, no roadside hardware | Sample bias, privacy, vendor dependence |
Connected vehicle data | Speed, braking, position, events | High resolution, real-time hazards | Penetration rate still growing |
Weather and road sensors | Rain, fog, ice, pavement temperature | Supports safety and winter operations | Local coverage only |
Environmental sensors | Air quality, noise | Supports emissions-based management | Added cost |
Satellite and drones | Wide-area traffic and incident views | Flexible, large-scale | Not continuous, regulatory limits |
Data fusion combines these sources (for example, loops for accurate counts and probe data for network coverage) to produce a better picture than any single sensor.
Communications
Fiber optics: backbone for control centers and key intersections
Cellular (4G/5G): flexible links for detectors, signals, and vehicles
DSRC and C-V2X: short-range vehicle-to-everything messaging (V2V, V2I, V2P), such as signal phase and timing, hazard warnings, and priority requests
Wireless mesh and radio links: low-cost roadside connections
Standards and cybersecurity: open protocols (such as NTCIP, DATEX II, and SAE message sets) and strong security are essential, since a compromised signal network is a safety risk
From Data to Decisions: Analytics and Machine Learning
What the analytics layer does
Task | Description | Typical methods |
|---|---|---|
Data cleaning and fusion | Remove errors, fill gaps, align sources | Statistical filters, Kalman filters, imputation models |
Incident detection | Spot crashes and breakdowns within seconds | Computer vision, anomaly detection, speed-drop algorithms |
Traffic state estimation | Estimate speed, density, and queue length on every link | Model-based estimation plus data assimilation |
Short-term prediction | Forecast flow and speed for 5 to 60 minutes ahead | LSTM and GRU networks, graph neural networks, gradient boosting |
Travel-time estimation | Predict journey times and their reliability | Regression, ensemble models, probabilistic models |
Demand estimation | Estimate origin-destination patterns | Matrix estimation, trajectory analytics |
Classification | Vehicle types, pedestrians, cyclists | Deep learning (CNNs) |
Optimization | Choose best signal timings, routes, and control actions | Reinforcement learning, model predictive control, mathematical optimization |
Simulation and digital twins | Test strategies before deployment | Microsimulation (such as SUMO, VISSIM), city-scale digital twins |
Machine learning approaches, in plain language
Supervised learning: learns from historical data with known outcomes, such as predicting tomorrow’s 8 a.m. speed from past patterns, weather, and events
Unsupervised learning: finds patterns without labels, such as clustering similar days or spotting unusual behavior
Reinforcement learning (RL): a controller learns by trial and error which signal timings reduce delay, using a simulator before real-world deployment
Computer vision: detects and tracks vehicles, people, and incidents from camera feeds
Graph neural networks: treat the road network as a graph, capturing how congestion spreads from one road to the next
Good practice in applying ML
Combine machine learning with traffic engineering knowledge (physics-informed or hybrid models), since pure black-box models can behave badly in unusual conditions
Validate on rare events such as crashes, floods, and large events, not only average days
Keep a fallback (fixed or actuated plans) if the model or data fails
Monitor model drift, since travel behavior changes over time
Make decisions explainable enough for operators to trust and override them
Core ITS Applications for Managing Congestion
1. Adaptive traffic signal control
Instead of fixed timing plans, signals adjust to real-time demand.
System type | How it works |
|---|---|
Fixed-time | Pre-set plans by time of day, no real-time response |
Actuated | Extends or skips phases based on detector calls |
Adaptive (such as SCOOT, SCATS, InSync, and similar) | Continuously adjusts cycle, split, and offset across a corridor or network |
ML and RL-based control | Learns optimal policies from data and simulation, adapts to changing patterns |
Benefits: reduced delay, fewer stops, better green waves, and faster recovery after incidents. Reported delay and travel-time improvements vary widely by site, from modest gains to double-digit percentages where fixed timing was outdated.
Related functions:
Transit signal priority: extends or advances green for buses and trams
Emergency vehicle preemption: clears the path for ambulances and fire engines
Pedestrian and cyclist detection: adjusts crossing times and protects vulnerable users
2. Freeway and highway management
Ramp metering: signals on entry ramps release vehicles at a controlled rate to keep the mainline flowing, often coordinated across several ramps
Variable speed limits (VSL): reduce speeds ahead of congestion to smooth flow and reduce shockwaves and rear-end crashes
Dynamic lane management: reversible lanes, hard shoulder running, and lane control signals
Queue warning: alert drivers to stopped traffic ahead
Dynamic message signs (VMS): show travel times, incidents, and alternative routes
Managed lanes and dynamic tolling: price adjusts with demand to keep express lanes moving
3. Incident management
Incidents cause a large share of delay, so faster detection and clearance has high value.
Detect: cameras, probe data, and AI spot slowdowns and stopped vehicles
Verify: operators confirm using CCTV
Respond: dispatch police, ambulance, tow trucks, and service patrols
Manage traffic: change signals, post messages, set diversion routes
Clear: remove the blockage as quickly and safely as possible
Review: analyze response times and improve
4. Traveler information
Real-time navigation and apps with live travel times and rerouting
Variable message signs and radio alerts
Public transport apps with real-time arrival information
Multimodal journey planners that compare options
Predictive information: forecasts of congestion for planned trips
5. Public transport management
Automatic vehicle location (AVL) and real-time arrival prediction
Headway management to prevent bus bunching
Dynamic dispatch and scheduling responding to demand
Smart ticketing and demand analytics
Bus rapid transit corridors with priority signals
6. Demand management and pricing
Congestion charging and cordon pricing
Dynamic parking guidance and pricing, reducing cruising for parking
Mobility as a Service (MaaS) that integrates transit, bikes, ride-hailing, and parking in one platform
Event and work zone management with staggered trips, shuttle services, and advance notice
7. Freight and logistics
Truck routing and parking information
Weigh-in-motion and electronic screening to reduce stops
Platooning (experimental in many regions)
Port and terminal gate coordination to prevent queues spilling onto public roads
Delivery slot management and curbside management in cities
8. Safety and enforcement
Automated enforcement: speed, red light, and bus lane cameras
Connected vehicle warnings: intersection collision, curve speed, and emergency braking alerts
Pedestrian detection and protection
Wrong-way driver detection
Road weather information systems: warnings and automated deicing or fog systems
9. Tolling and payment
Electronic toll collection (RFID, transponders, and ANPR) removes stop-and-pay queues
Open road tolling with free-flow lanes
Interoperable payments across operators
Connected and Automated Vehicles in ITS
V2I (vehicle to infrastructure): signals send their phase and countdown to vehicles, enabling smoother speed choices and green-light speed advisories
V2V (vehicle to vehicle): direct sharing of position, speed, and braking
V2P (vehicle to pedestrian): alerts for vulnerable users
Cooperative adaptive cruise control and platooning: closer, smoother following
Probe data from vehicles: rich, real-time network monitoring
Automated vehicle integration: dedicated lanes, shared map data, and shared hazard information
Benefits grow with the share of connected vehicles, so planning must cover mixed traffic for many years.
The Traffic Management Center (TMC)
The TMC is the operational hub of an ITS.
Operators monitor video walls, dashboards, and alerts
Integrated platforms show data from signals, freeways, transit, and incidents on one map
Decision support suggests response plans, such as diversion routes, based on the scenario
Interagency coordination between traffic, police, fire, EMS, transit, and road maintenance
Standard operating procedures for incidents, events, weather, and failures
24/7 staffing, backup power, and redundancy for resilience
Designing and Implementing an ITS Project
Define goals and performance measures: for example, reduce corridor travel time by a set percentage, cut incident clearance time, or improve reliability
Assess the current situation: crash and congestion data, existing equipment, institutional arrangements
Develop a system architecture: use regional frameworks and standards for interoperability
Select technologies based on needs, data quality requirements, budget, and maintenance capacity
Plan data governance: ownership, sharing, privacy, retention, and quality control
Design communications and power with redundancy
Pilot and simulate: test on a corridor or in a digital twin before scaling up
Procure and install, with clear performance specifications and acceptance tests
Train staff and set operating procedures
Operate, maintain, and evaluate with before-and-after studies
Upgrade continuously as technology and needs change
Measuring Performance
Measure | Meaning |
|---|---|
Travel time and speed | Basic efficiency |
Delay and stops per trip | Quality of flow |
Travel time reliability (such as the buffer index or planning time index) | Predictability of trips |
Throughput (vehicles or people per hour) | Use of capacity |
Incident detection and clearance time | Effectiveness of management |
Crash frequency and severity | Safety outcomes |
Emissions and fuel use | Environmental performance |
Transit on-time performance | Reliability for public transport |
System availability (uptime of detectors and signals) | Health of the system |
User satisfaction | Public acceptance |
Use before-and-after studies and control sites to separate real ITS benefits from general traffic trends.
Benefits
Lower delay and more predictable journey times
Higher use of existing road capacity
Faster response to crashes, reducing secondary crashes
Lower fuel use and emissions from smoother flow
Better public transport reliability
Improved safety for all road users, including pedestrians and cyclists
Better evidence for planning and investment decisions
Challenges and Risks
Challenge | Notes |
|---|---|
Cost and funding | Capital, operations, and replacement costs, plus skilled staff |
Data quality | Sensor failures, gaps, bias, and inconsistent formats |
Privacy | Vehicle tracking and cameras raise legal and ethical issues, so anonymization, limited retention, and clear rules are necessary |
Cybersecurity | Signals and control systems are critical infrastructure and can be attacked |
Interoperability | Different vendors and agencies using incompatible systems |
Institutional coordination | Traffic, police, transit, and regional authorities must cooperate |
Mixed traffic | Heterogeneous traffic, such as two-wheelers, pedestrians, and non-lane-based behavior, makes some sensing and models less accurate in many developing-country cities |
Model reliability | ML models can fail in rare or novel conditions |
Public acceptance and equity | Pricing and enforcement need fair design, and benefits should reach all communities |
Maintenance | Sensors and communications degrade, and a neglected ITS loses value quickly |
Induced demand | Better flow can attract more trips, so ITS works best with demand management and public transport |
ITS in the Indian and Developing-City Context
Many cities are deploying Integrated Command and Control Centres (ICCC) under smart city programs, with adaptive signals, CCTV, ANPR, and variable message signs
Electronic toll collection (FASTag) is widely used on national highways
Heterogeneous traffic (two-wheelers, autorickshaws, buses, trucks, pedestrians, and animals) requires sensors and models trained on local conditions
Probe data from smartphones and fleets is often the fastest way to cover large networks
Priority areas: adaptive signals on key corridors, bus priority, incident management on highways, and safety for vulnerable road users
Institutional capacity and long-term maintenance funding are as important as the technology itself
Emerging Trends
Digital twins of cities and corridors for testing control strategies in real time
Edge computing that processes video and data at the roadside for lower latency
5G and C-V2X for more reliable connected-vehicle services
Reinforcement learning controllers moving from research to deployment
Mobility data marketplaces and open data standards
Integration with electric vehicle charging, curb management, and drones
Automated and connected freight corridors
Generative AI for operator assistance, incident summaries, and scenario planning
Network-wide, multimodal optimization rather than separate control of each mode
Common Mistakes
Buying technology before defining the problem and performance goals
Installing sensors without a plan for maintenance and data quality
Using black-box ML without validation or a fallback plan
Ignoring institutional coordination, so data and control stay in silos
Neglecting cybersecurity and privacy until after deployment
Choosing proprietary systems that lock the agency into one vendor
Failing to train and retain operators
Not measuring results, so benefits cannot be shown or improved
Relying only on ITS when the root cause is insufficient capacity, poor public transport, or unmanaged demand
Conclusion
ITS works by closing a loop: sense, predict, decide, act, and learn. Sensors and connected vehicles describe what is happening now, machine learning anticipates what will happen next, and control systems adjust signals, speeds, routes, and information before small problems turn into gridlock. The strongest programs treat technology as one part of a larger system: clear goals, good data governance, trained operators, cybersecurity, well-maintained equipment, and coordination between agencies. Used this way, ITS gets measurably more out of the roads, rails, and bus lanes a city already has, and gives a foundation for connected and automated mobility in the future. Performance figures and technologies here are general, so any real project should be based on local data, pilots, and standards, and evaluated against clear before-and-after measures.