


Article details
A psychrometric chart, also known as a psychrometric diagram or Molly chart, is a graphical representation of the relationship between various physical and thermodynamic properties of air.
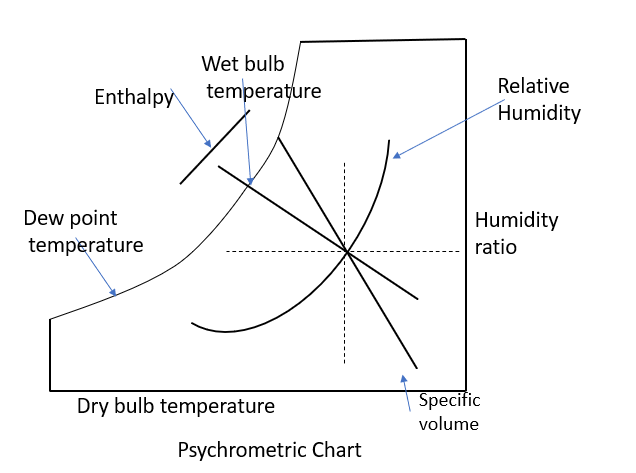
A psychrometric chart is a graphical representation of various thermodynamics properties of moist air. This chart is normally drawn for standard atmospheric pressure 1.01325 bar at sea level. The variables shown on psychrometric chart are WBT, relative humidity, vapor pressure, total heat, and actual moisture content of the air. In psychrometric chart, the ordinate is mass of the water vapor per kg of dry air and the abscissa is the dry bulb temperature.
It's a powerful tool used in the field of heating, ventilation, and air conditioning (HVAC) to analyze and design air conditioning systems, industrial processes, and other applications involving air mixtures.
A typical psychrometric chart displays the following properties:
1. Dry-bulb temperature (DBT)
2. Wet-bulb temperature (WBT)
3. Relative humidity (RH)
4. Specific humidity (SH)
5. Enthalpy (H)
6. Specific volume (SV)
By using a psychrometric chart, engineers and technicians can:
- Analyze air conditions and determine the potential for condensation or drying
- Calculate the amount of moisture in the air
- Determine the energy required for heating, cooling, or dehumidifying air
- Design and optimize air conditioning systems, cooling towers, and other processes

DBT Lines
The dry bulb temperature lines extend vertically upwards. And there is one line for each degree of temperature.
WBT Lines
The wet bulb temperature lines extend diagonally downwards to the right. There is one line for each degree of temperature.
RH Lines
The relative humidity lines are curved lines on psychrometric chart. There are various relative humidity lines indicated on the charts. The 100% RH line or saturation curve becomes the boundary of the chart on the left-hand side. The region beyond this 100% RH lines are supersaturated zone or fog zone.

Specific humidity lines
The scale for specific humidity lines is vertical scale on the right side of the psychrometric chart. This scale is in grams of moisture per kg dry air.
DPT Lines
The scale for dew point temperature is identical to the scale of WBT lines. The DPT lines run horizontal to the right.
Specific volume lines
The specific volume lines are drawn along the sole chart and they equally spaced diagonal lines.
Specific enthalpy lines
These lines are similar to the WBT lines. These lines indicate the total heat content.