

Article details
A fan's rating on a spec sheet is not a single number, it's a range of possible operating points, and a fan only actually performs the way its rating suggests at one specific combination of airflow and pressure. Understanding why requires looking at two curves together, the fan's own performance curve and the system it's actually installed into, because a correctly rated fan installed into the wrong system will settle at an entirely different operating point than the one anyone expected.
What a Fan Curve Actually Shows
A fan curve plots the relationship between airflow, typically in cubic feet per minute, and static pressure, the resistance a fan is working against, across the fan's entire operating range. As static pressure increases, the airflow a given fan can deliver decreases, and this relationship is genuinely inherent to how fans work, not a flaw or inefficiency, a fan simply moves less air when it's pushing against more resistance, and moves more air when resistance is lower.
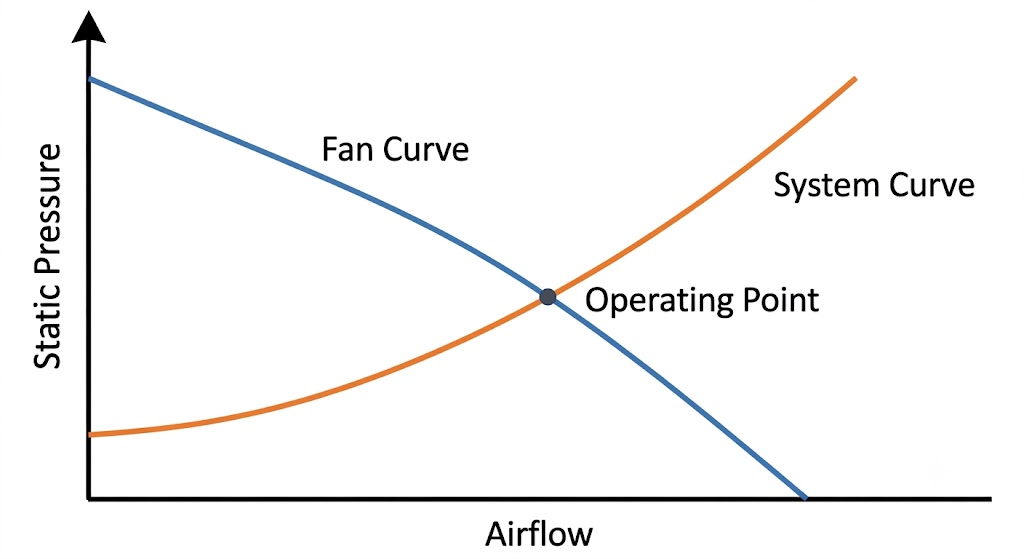
A manufacturer's fan curve typically shows this relationship as a downward sloping line, high airflow at low static pressure, progressively less airflow as static pressure increases, eventually reaching a point where the fan can no longer move meaningful airflow at all against very high resistance. Every point along this curve represents a valid, physically real operating condition, the curve isn't describing one performance number, it's describing every possible performance number depending on what resistance the fan actually encounters.
What a System Curve Actually Shows
A system curve describes the opposite relationship, how much static pressure resistance the actual installed ductwork, fittings, filters, and coils present at different airflow rates. As covered in duct static pressure, resistance increases as airflow increases through a given system, and this relationship also plots as a curve, typically rising in a roughly parabolic shape, low resistance at low airflow, increasingly steep resistance as airflow through that same fixed ductwork increases.
Unlike a fan curve, which describes a piece of equipment's capability, a system curve describes a specific installed system's actual physical characteristics, duct sizing, fitting count, filter selection, and every other resistance contributing element covered in duct static pressure. Two different buildings, even with identical airflow requirements on paper, can have genuinely different system curves if their actual ductwork design differs.
Why the Two Curves Together Reveal the Real Operating Point
A fan doesn't operate at whatever point a manufacturer's rating happened to specify. It operates at whatever point its own fan curve intersects the actual system curve it's installed into, the one specific combination of airflow and pressure where the fan's capability and the system's resistance genuinely balance against each other.
This is the concept that explains why a correctly rated fan can still underperform in a specific installation. If the actual installed system presents more resistance than the fan curve was rated against, undersized ductwork, more fittings than originally designed, a higher resistance filter installed later, the true operating point shifts along the fan curve toward lower airflow at higher pressure, exactly where the fan curve and the actual, higher resistance system curve now intersect. The fan itself hasn't changed or failed in any way. It's simply settling at a genuinely different, lower airflow operating point than the original design assumed, because the system it's actually working against no longer matches the system curve it was originally selected for.
A Concrete Way to Picture This
Imagine plotting both curves on the same graph, airflow along one axis, static pressure along the other. The fan curve slopes downward, less airflow as pressure rises. The system curve slopes upward, more pressure as airflow rises. Wherever these two curves cross is the actual operating point, the only combination of airflow and pressure where both curves agree, and it's genuinely the only point that matters for real world performance, regardless of what a single number on a spec sheet might have suggested in isolation.
If the actual system curve shifts, more resistance added somewhere in the ductwork after original design, that upward sloping system curve effectively steepens or shifts, and the intersection point with the same unchanged fan curve moves to a new location, generally toward lower airflow, exactly capturing why the same fan delivers less air than expected once real world resistance exceeds what was originally assumed.
Why This Matters for Design and Troubleshooting
Understanding this relationship changes how both design and diagnosis should actually work. During design, selecting a fan requires understanding the system's actual anticipated curve, not just a target airflow number in isolation, since the same target airflow can require a genuinely different fan selection depending on how much resistance the specific system presents. Selecting based purely on a desired airflow number, without genuinely accounting for the system curve that airflow will actually operate against, is a common design gap that shows up later as underperformance nobody can immediately explain.
During troubleshooting, a system delivering less airflow than expected is often not a fan problem at all, it's frequently a system curve problem, actual installed resistance exceeding what was assumed during design, exactly the undersized ductwork, excessive fittings, or restrictive filter issues covered in duct static pressure. Recognizing that the fan curve and system curve intersection, not the fan's rated capability alone, determines real performance is what points troubleshooting toward the actual cause rather than incorrectly concluding the fan itself is faulty or undersized.
The Practical Takeaway
A fan's rated performance is only ever accurate at the specific operating point its own curve intersects with the system it's actually installed into. A correctly selected, correctly rated fan can still underperform badly if the real installed system presents more resistance than the system curve it was designed against, and understanding both curves together, rather than treating a fan's rating as a single fixed number, is what actually explains why this happens and how to properly diagnose it when it does.
EveryEng. For everyone in Engineering.