


Article details
When a structural beam or component experiences a transverse load, it doesn't just bend; it also undergoes shear forces. These internal forces try to slide parallel slices of the beam past one another.
The resulting shear stress (τ) is not uniform across the beam's height. Instead, it varies depending on the geometry of the cross-section. The distribution is calculated using the standard Jourawski shear stress formula:

Where:
V: The total transverse shear force acting on the section.
Q: The first moment of area of the section above (or below) the level where stress is being calculated (Q = Aȳ).
I: The total moment of inertia of the entire cross-section about the neutral axis.
b: The width of the cross-section at the specific point where you are calculating the stress.
Here is how this stress distributes across the most common structural geometries:
1. Rectangular Cross-Section (Parabolic Distribution)
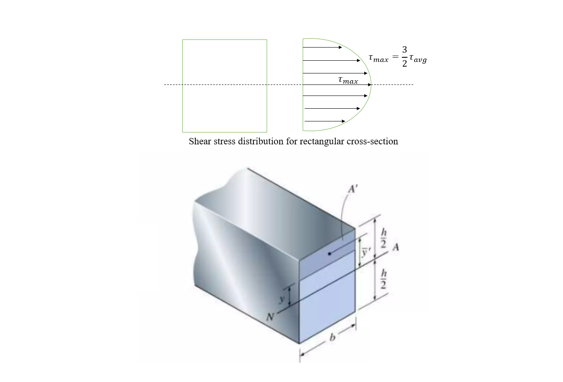
For a solid rectangular beam of width b and total height h, the shear stress distribution follows a perfect parabolic curve.
At the Top and Bottom Surfaces (y = +- h/2): The shear stress is exactly zero. This is because there is no remaining cross-sectional area above or below these edges to create a moment of area (Q = 0).
At the Neutral Axis (y = 0): The shear stress reaches its absolute maximum (τ_max).
The Relationship: The maximum shear stress in a rectangular section is exactly $1.5$ times (3/2) the average shear stress (τ _{avg} = V/A):

2. Circular Cross-Section (Parabolic Distribution)
Similar to the rectangle, a solid circular cross-section with radius R (or diameter D) exhibits a parabolic shear stress profile, but the geometry changes the peak intensity.
At the Outer Extremities: The shear stress is zero.
At the Neutral Axis: The shear stress reaches its maximum.
The Relationship: Because the width (b) varies across a circle alongside the area, the math shifts slightly. The maximum shear stress is 1.33 times (or 4/3) the average shear stress:

3. I-Beam / Flanged Section (The Abrupt Jump)
The I-beam is engineered specifically to exploit shear and bending laws. It consists of two wide flanges (top and bottom) and a central vertical web.
Because the width (b) drops abruptly when transitioning from the wide flange to the narrow web, the shear stress experiences a massive, instantaneous jump in value.
In the Flanges: The width (b) is very large, keeping the shear stress incredibly low. The flanges carry less than 5% of the total shear force (their primary job is to resist bending).
At the Flange-Web Junction: The moment of area (Q) remains the same, but the width (b) suddenly plummets from the flange width (B) to the web thickness (t_w). Because b is in the denominator of our formula (VQ/Ib), the stress shoots upward instantly.
In the Web: The stress continues along a parabolic trajectory through the web, peaking at the neutral axis. The narrow web typically carries 95% to 98% of the entire structural shear load.
4. T-Section (Asymmetric Distribution)
Because a T-beam is asymmetrical, its neutral axis (NA) does not sit right in the middle of its total height; it shifts upward toward the heavier flange.
The Distribution Profile: The curve remains parabolic, but the peak of the parabola occurs at the shifted neutral axis, closer to the top flange.
The Jump: Just like the I-beam, there is a sudden, dramatic spike in shear stress at the exact junction where the wide flange meets the narrow vertical stem.
Summary Cheat Sheet
Cross-Section Shape | Location of τmax | Value of τmax relative to τavg | Distribution Profile Type |
Rectangle | Neutral Axis (Center) | 1.5 τ_{avg} | Continuous Parabola |
Circle | Neutral Axis (Center) | 1.33 τ_avg | Continuous Parabola |
I-Beam | Neutral Axis (Center) | Dominates the Web | Discontinuous Parabola (Sudden jump at web junction) |
T-Beam | Shifted Neutral Axis | Located in the Stem | Discontinuous Parabola (Sudden jump at stem junction) |