


Article details
An S-N Diagram (also called an S-N Curve or Wöhler Curve) is a graphical representation used in engineering to show the relationship between the stress applied to a material and the number of cycles it can withstand before failure due to fatigue.
S = Stress amplitude
N = Number of cycles to failure
The S-N diagram is extremely important in mechanical, structural, aerospace, and automotive engineering because many machine components fail due to repeated or fluctuating loading rather than a single heavy load.
Basic Concept of S-N Diagram
When a material is subjected to repeated loading and unloading, tiny cracks begin to develop inside the material. Over time, these cracks grow and eventually lead to fatigue failure.
The S-N curve helps engineers determine:
How long a component will survive under cyclic loading
The fatigue strength of a material
Safe stress limits for machine parts
The expected fatigue life of structures
S-N Curve Relationship
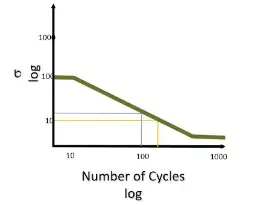
The curve shows that:
At high stress levels, the material fails after a small number of cycles
At low stress levels, the material survives for a larger number of cycles
For some materials like steel, there exists an endurance limit, below which the material can theoretically withstand infinite cycles without failure.
Typical S-N Curve
Relationship between cyclic stress and number of cycles to failure in fatigue analysis.

Important Terms in S-N Diagram
1. Fatigue Life
The total number of stress cycles a material can endure before failure occurs.
2. Endurance Limit
The maximum stress level below which a material can survive an infinite number of cycles.
3. Fatigue Strength
The stress value corresponding to a specific number of cycles.
4. Cyclic Stress
Repeated loading and unloading experienced by a component.
Applications of S-N Diagram
Engineers use S-N diagrams in designing:
Shafts
Springs
Turbine blades
Aircraft wings
Bridges
Rotating machinery
Automotive components
For example, a rotating shaft in a motor experiences repeated bending stress. Using the S-N curve, engineers can estimate how many operating cycles the shaft can safely withstand.
Advantages of S-N Diagram
Helps prevent fatigue failure
Improves safety and reliability
Assists in material selection
Useful in life prediction of components
Reduces maintenance and unexpected breakdowns
Conclusion
The S-N Diagram is one of the most important tools in fatigue analysis and mechanical design. It helps engineers understand how repeated stresses affect material life and enables them to design safer and longer-lasting components. By studying the relationship between stress and number of cycles, engineers can prevent catastrophic failures in machines and structures.
Typical S-N Curve
Relationship between cyclic stress and number of cycles to failure in fatigue analysis.
cycles | stress |
|---|---|
10³ | 500 |
10⁴ | 420 |
10⁵ | 340 |
10⁶ | 260 |
10⁷ | 220 |
10⁸ | 200 |