7 QC tools and its applications
7 QC tools and its applications

- 7-day money-back guarantee
- Lifetime access
- Certificate of completion
Why enroll
What enrolled engineers say
Initially, I wasn’t sure what to expect from this course. Coming from oil & gas and energy utilities, QC tools are often mentioned but rarely taught in a structured way. The walkthrough of the seven basic tools—especially Pareto charts, cause-and-effect diagrams, and control charts—lined up well with issues seen in gas compression reliability and power plant outage analysis. One challenge was translating the examples into messy, real field data. In utilities, process data from SCADA systems isn’t always clean or normally distributed, which makes classic SPC limits tricky. The course touched on this only lightly, so some judgment is still needed when applying control charts to transient conditions like startups or load changes. A practical takeaway was how to combine a Pareto analysis with a fishbone diagram to avoid jumping straight to conclusions. That approach is useful when dealing with recurring pipeline maintenance defects or transformer failures, where multiple contributing factors interact at the system level. Compared with typical industry practice, which often jumps straight to formal RCA templates, this course reinforced the fundamentals first. Overall, it felt grounded in real engineering practice.
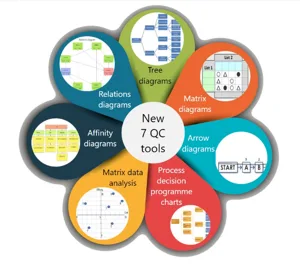
At first glance, the topics looked familiar, but the depth surprised me. The walkthrough of the seven QC tools went beyond textbook definitions and showed where they actually fit in day‑to‑day engineering work. In oil and gas operations, tools like Pareto charts and fishbone diagrams map well to recurring issues such as pump seal failures or pipeline leak root causes. Similar patterns show up in energy utilities, especially when analyzing forced outages in thermal plants or nuisance trips in substations. One challenge was translating these beginner‑level tools into heavily regulated environments. For example, control charts are useful, but in a refinery or power station the data is often sparse, noisy, or filtered through SCADA systems, which creates edge cases the course only lightly touched on. Still, the comparison between the traditional seven QC tools and the newer ones helped frame when a simple check sheet is enough versus when affinity diagrams or tree diagrams make more sense. A practical takeaway was using Pareto analysis earlier in troubleshooting instead of jumping straight to design changes. Compared with common industry practice, this reinforces discipline at the system level. The content felt aligned with practical engineering demands.
Your instructor
Enggenious (SAN Techno Mentors)
People Transformation
Is this course for you?
You should take this if
- You work in Manufacturing & Industrial
- You're a Quality & Management Standards professional
- You prefer self-paced learning you can revisit
You should skip if
- You need a different specialisation outside Quality & Management Standards
- You need live interaction with an instructor
Course details
Course suitable for
Key topics covered
Course content
The course is readily available, allowing learners to start and complete it at their own pace.
- 7 QC Tools27 min
Opportunities that await you!
Career opportunities
Why people choose EveryEng
Industry-aligned courses, expert training, hands-on learning, recognized certifications, and job opportunities-all in a flexible and supportive environment.


 Aug 29, 2026